Companies mentioned: INTC 0.00%↑, AMD 0.00%↑, HPE 0.00%↑
Twice every year, the high-performance computing industry publishes a list of the top 500 supercomputers in the world, aptly named the Top500. A beacon in performance and scale, the Top500 suffers from selection bias – only those who run a specific test and submit a result get listed in the database. Nonetheless, companies and government institutions compete for rankings as well as funding to build systems to achieve those rankings – and sometimes that funding is provided years in advance. This also requires the semiconductor industry, CPUs, GPUs, and other accelerators, to also offer high-performance hardware in that timeframe.
One such funding contract was for a supercomputer to be built at the Argonne National Lab – a supercomputer that was given the name Aurora. Initially tendered in early 2016 for an expected 2018 deployment, after years of delays and architecture changes due to equipment partner slips, this week the Top500 finally received a submission from Argonne unveiling the Aurora supercomputer. Even though it was plagued with ever changing expectation, priorities, and delays, Aurora is finally stable enough to have performed a single run and submitted said results to the Top500 list.
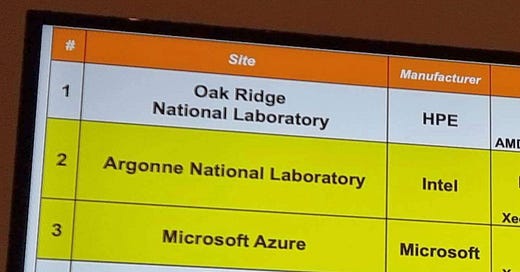
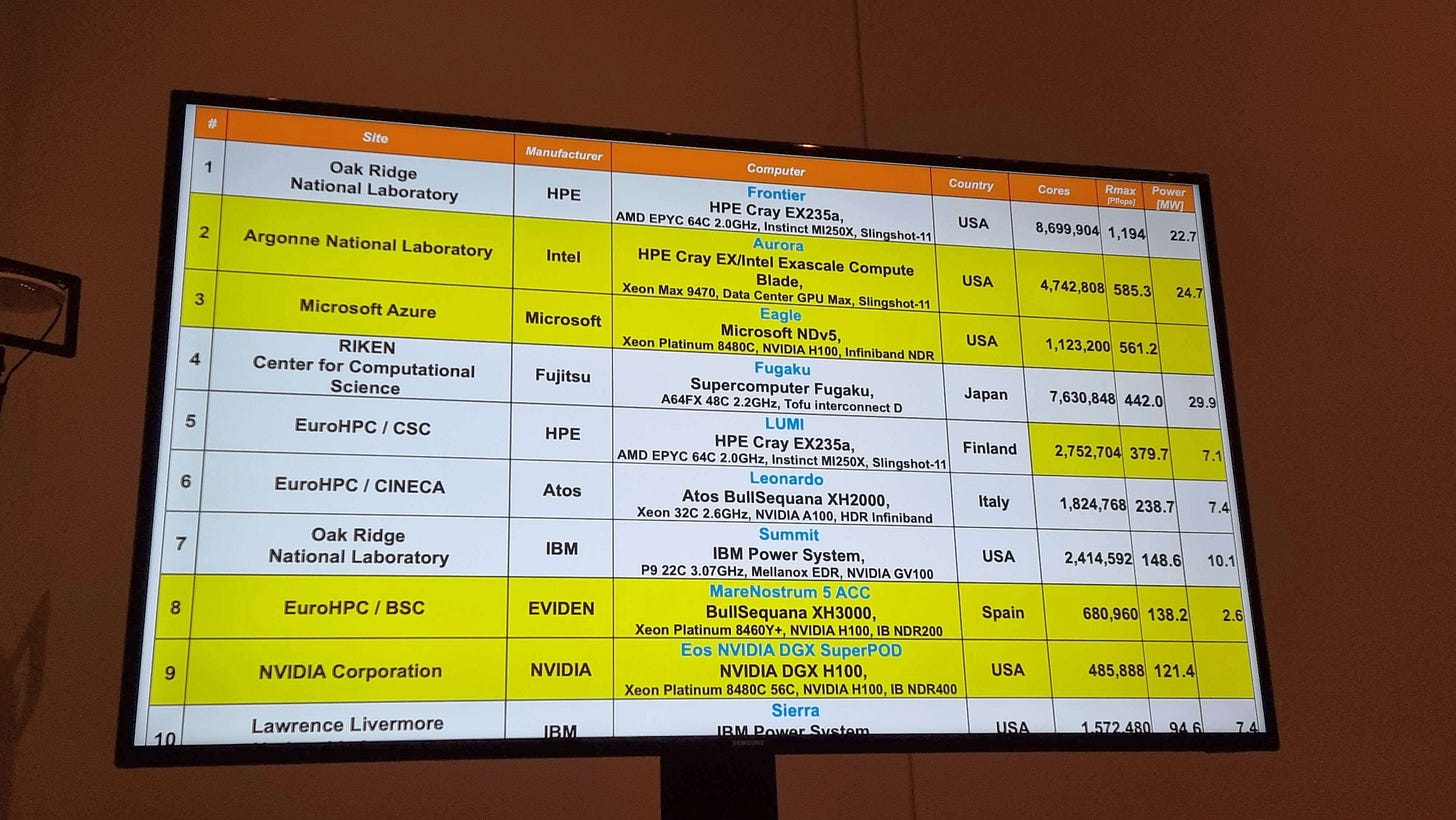
Maintaining #1 on the list is Frontier, an AMD system at Oak Ridge National Labs using EPYC CPUs and MI250X GPUs, sitting at 1.194 ExaFLOPs for 22.7 megawatts of power. Aurora, as we’ll discuss below, is at number two, while Microsoft Azure is another new entrant at #3 with a cloud based supercomputer, the most powerful of its kind. Former world #1 Fugaku, using an Arm based processor, is #4, followed by an AMD-powered Lumi in Finland at #5.
The Aurora System and Sub-System
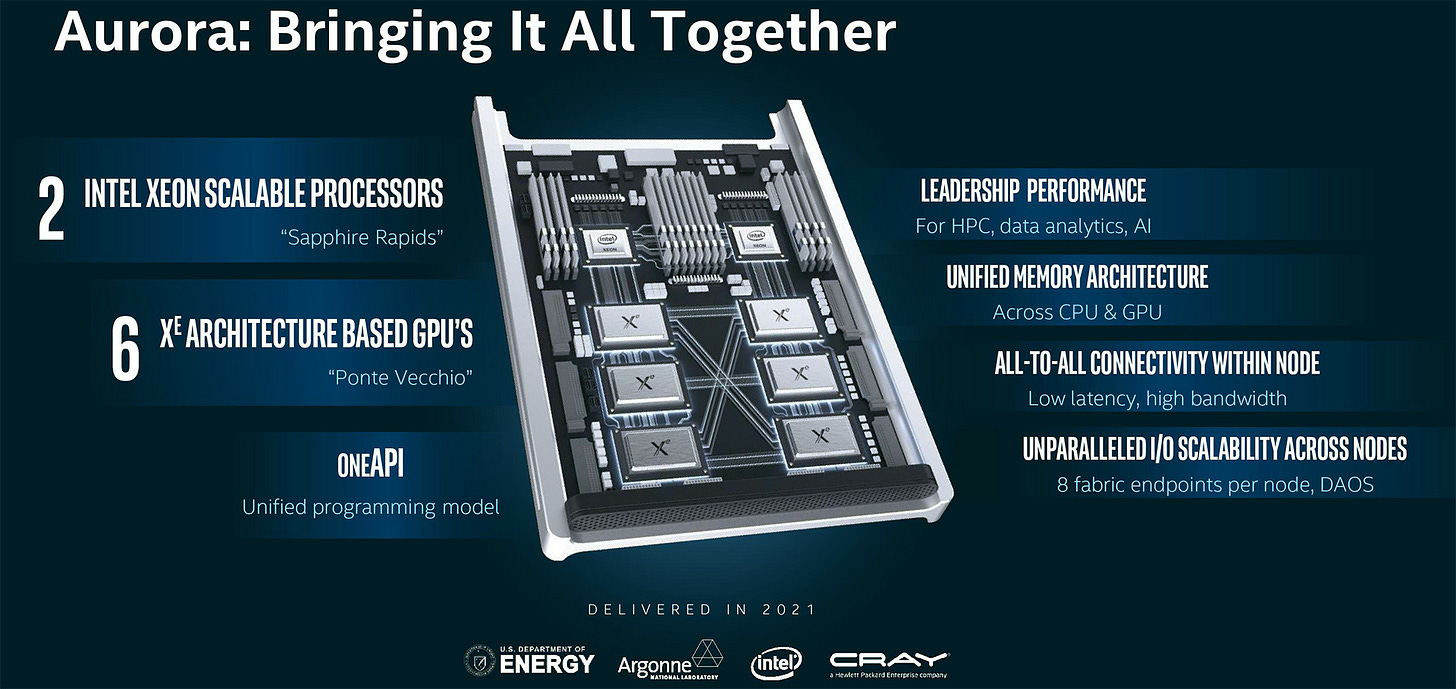
Aurora’s current architecture is a fully enabled Intel system, with Intel’s ‘GPU Max’ 1550 GPU (codenamed Ponte Vecchio) at the heart. Aurora uses ten thousand compute blades, each featuring a pair of HBM equipped Sapphire Rapids CPUs and 6 Ponte Vecchio GPUs. Beyond the compute blades, the systems backbone (often just as important, if not more so) is made up of eight HPE Slingshot-11 interconnects, each providing 200 Gb/s of sustained network bandwidth. On paper it sounds like a recipe for success. With classical and AI HPC workloads being more and more bandwidth constrained, having HBM based GPUs and CPUs sounds like a dream. If we add onto that eight distinct 200 Gb/s end-points to each node, software engineers for this system should be in for a great time.
Unfortunately, as much as the word ‘Aurora’ itself may conjure up dreams of bright skies and beautiful phenomena, reality dictates otherwise. Aurora’s Top500 run, by standard metrics, comes across a sad showing even after 5 years of delays.
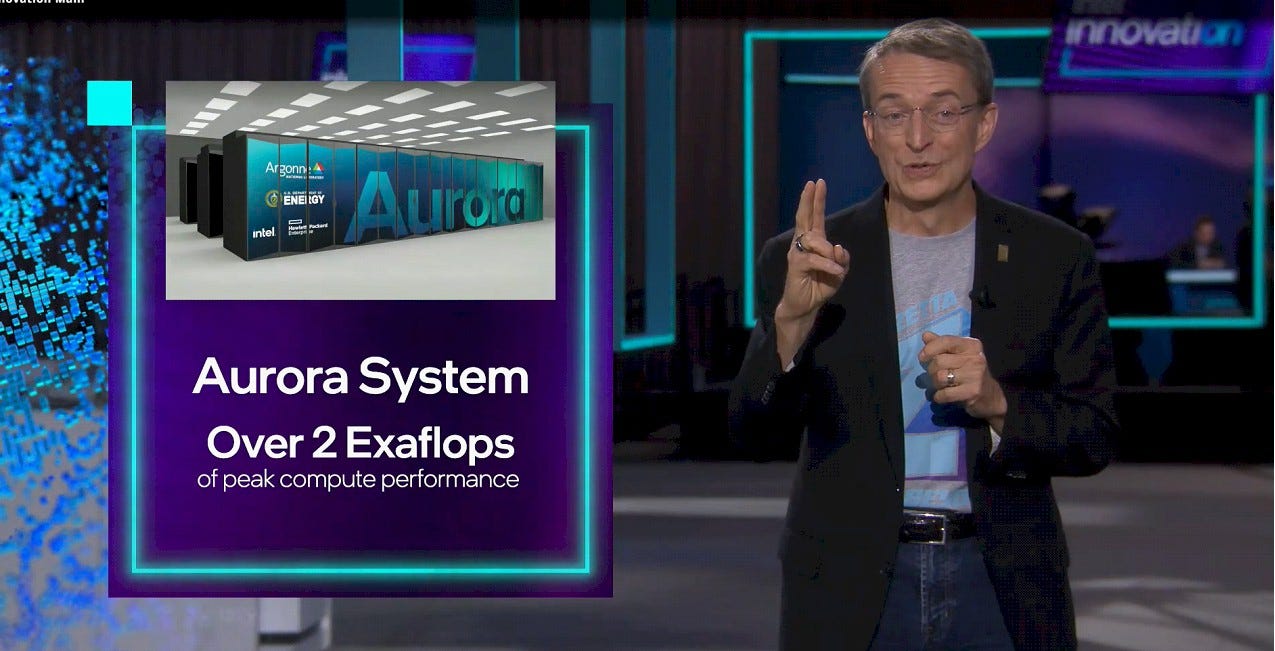
Looking at the facts as presented, the Aurora system submission to the Top500 list is using half of the actual deployed Aurora machine. This is important given that Intel has showcased that Aurora at full strength should be a 2+ ExaFLOP system for around 50 megawatts of power. The submission produced 0.585 ExaFLOPs, around a quarter of the expected performance, consuming 24.7MW, around half the power.
Had this result been submitted 2 or more years ago, even as a ‘full’ machine, the general consensus among media attendees at the Supercomputing conference this result was announced at, it would have been perfectly respectable. However, in late 2023, the results look questionable at best. Questions are being asked if Argonne, the lab that won the contract, HPE, the system supplier, and Intel, the hardware vendor, are pleased with this result.
It becomes a particularly poignant question when we compare the result to the world #1 supercomputer. This is Frontier, which was delivered 18 months earlier, and delivered 1.2 ExaFLOPs while consuming 22.7MW of power. So roughly double the performance, for the same power, but 18 months ago.
The Minutiae
As always, the devil is in the details. While neither Argonne nor Intel had a representative at the press event which announced the results, we probed for further information.
One immediate response is that while only half a system was used for the benchmark run, the full system was actually powered on and so the result includes the power for the infrastructure of a full system working. So while half the system is running the benchmark, you still have idle power draw, storage systems, cooling infrastructure, monitoring infrastructure and more to include. That point is valid, and speaks to the point that this machine is still a work in progress. However, an issue is that when you make allowances for this fudge factor, things still aren’t great.
If you take the stance that the rest of the full system is still running, but at idle, and included in the power metric, how much would that skew the numbers? We spoke to a few people who offered estimates for a ballpark using 2-4 MW while idle. This would mean 0.585 ExaFLOPs were achieved using ~20-22 MW of power. It doesn’t look good from a peak efficiency point of view, as it would mean half of Aurora consumes the same amount as all of Frontier while achieving half the performance. Restated, it makes Aurora look like it’s half as efficient compared to Frontier. Or in short, 36 megawatts per ExaFLOP.
If we take a more significant power draw from the idle infrastructure, more along the lines of 8-10 MW, then you have a system producing 0.585 ExaFLOPs while ‘only’ drawing 12-14 MW. Not amazing, but slightly better from a peak efficiency standpoint – 22 megawatts per ExaFLOP. As a point of reference, Frontier is 19 megawatts per ExaFLOP.
But that would point to the idle power of Intel’s CPU Max and GPU Max systems being extremely high - nearly high enough to discount their prospects in cloud systems. There is some credence to this, as CPU Max using HBM is known to have a high idle power draw. But the question remains: are the inefficiencies caused by poor peak efficiency (silicon or software), or by poor idle power? If and when we get a full system benchmark, probably in mid-2024, we’ll get a clearer picture.
Efficiency Matters
In the name of fairness, particularly to the folks at the Argonne Leadership Computing Facility, it is important to note that the final compute blades of Aurora were only delivered in late June and that top 500 submissions are due in October. That amounts to a single quarter to get one of the biggest machines on the planet fully integrated, running well together, tested, and potentially optimized. Beyond the basics, it includes the work of porting codes that will eventually run on this machine over the course of its lifetime.
You can see the results of the short timeframe in the comparison of other metrics tracked by the Top500. Each supercomputer on the list has two numbers: RMax, the theoretical maximum performance given the frequency of the hardware and the number of compute units, and RPeak, the actual achieved and measured maximum performance (what we were talking about above). The ratio of RPeak to RMax gives some insights into each system on the Top500 list as to how easy it is to extract performance from a system. Typically a system with a high RPeak to RMax is a crown worth holding. Most accelerator based systems on the list sit in the 65-75% range, and a select few sit above 80%. Anything lower than 60% sounds unoptimized or may have additional consideration.
The Aurora submission only reaches 55% of that ratio. With that number, it becomes clear how little time the ALCF team had to work on optimized performance. Beyond engineering time to put together a benchmark run, it is worth looking at the underlying hardware for answers. Below the fold for the subscribers, we go into these details, as well as some of the other Top500 data.


